
With enrollment growing in Medicare Advantage (MA) plans, the private alternative to traditional fee-for-service Medicare, it is important to understand how they affect the health care delivered to their enrollees. While evidence largely indicates that access to care is similar for beneficiaries in MA plans and traditional Medicare, the data around quality of care has been mixed. Little information is available about how the type of coverage affects social drivers of health, care coordination, and other components of care.
To incentivize the provision of efficient, high-quality care, the federal government makes capitated payments to MA plans, meaning payments are not directly tied to enrollees’ use of services. In contrast, there is no limit on government spending on beneficiaries in traditional Medicare and few incentives to provide efficient care. MA plans may, in turn, either directly or indirectly pass these efficiency and quality incentives along to providers, such as by enabling care to be coordinated more easily, sharing financial risk with providers, and reducing the time they spend on administrative tasks. MA plans may be more likely to pass incentives along to primary care physicians (PCPs), who often help prevent costly, long-term health issues. PCPs also provide referrals to specialists, and MA plans that work closely with PCPs may be able to ensure that their enrollees are referred to less costly in-network providers.
Prior research suggests that MA plans’ incentives for providers may substantially spill over from MA patients to also affect the care and costs of patients in the same clinic covered by traditional Medicare.2 MA plans could also decrease the amount of time PCPs can spend with all their patients if the plans’ utilization management techniques, such as prior authorization or billing requirements, are more time-intensive.
This data brief examines whether PCPs who primarily serve MA patients report differences in care delivery, care coordination, and administrative burden compared to those who mostly serve traditional Medicare patients. The analysis relies on United States–specific data from the Commonwealth Fund’s 2022 International Health Policy Survey of Primary Care Physicians, involving 453 PCPs. We also used 2021 Medicare claims data to classify PCPs into three groups (see “How We Conducted This Study” for details):
- PCPs who predominantly serve traditional Medicare patients, meaning 60 percent to 100 percent of their Medicare patient panel was covered by traditional Medicare.
- PCPs who predominantly serve MA patients, meaning 60 percent to 100 percent of their Medicare patient panel was covered by MA.
- PCPs who had a patient panel with a mix of both types of coverage, meaning fewer than 60 percent traditional Medicare but more than 40 percent MA.
We analyzed survey responses with a specific focus on questions about care practices that MA plans could be incentivizing or otherwise encouraging. We discuss how aspects of care reported by PCPs vary across these different patient panel mixes. All respondents included in this analysis had Medicare patient panels greater than 10 people to minimize the likelihood of responses reflecting PCP experiences with non-Medicare patients.
Highlights
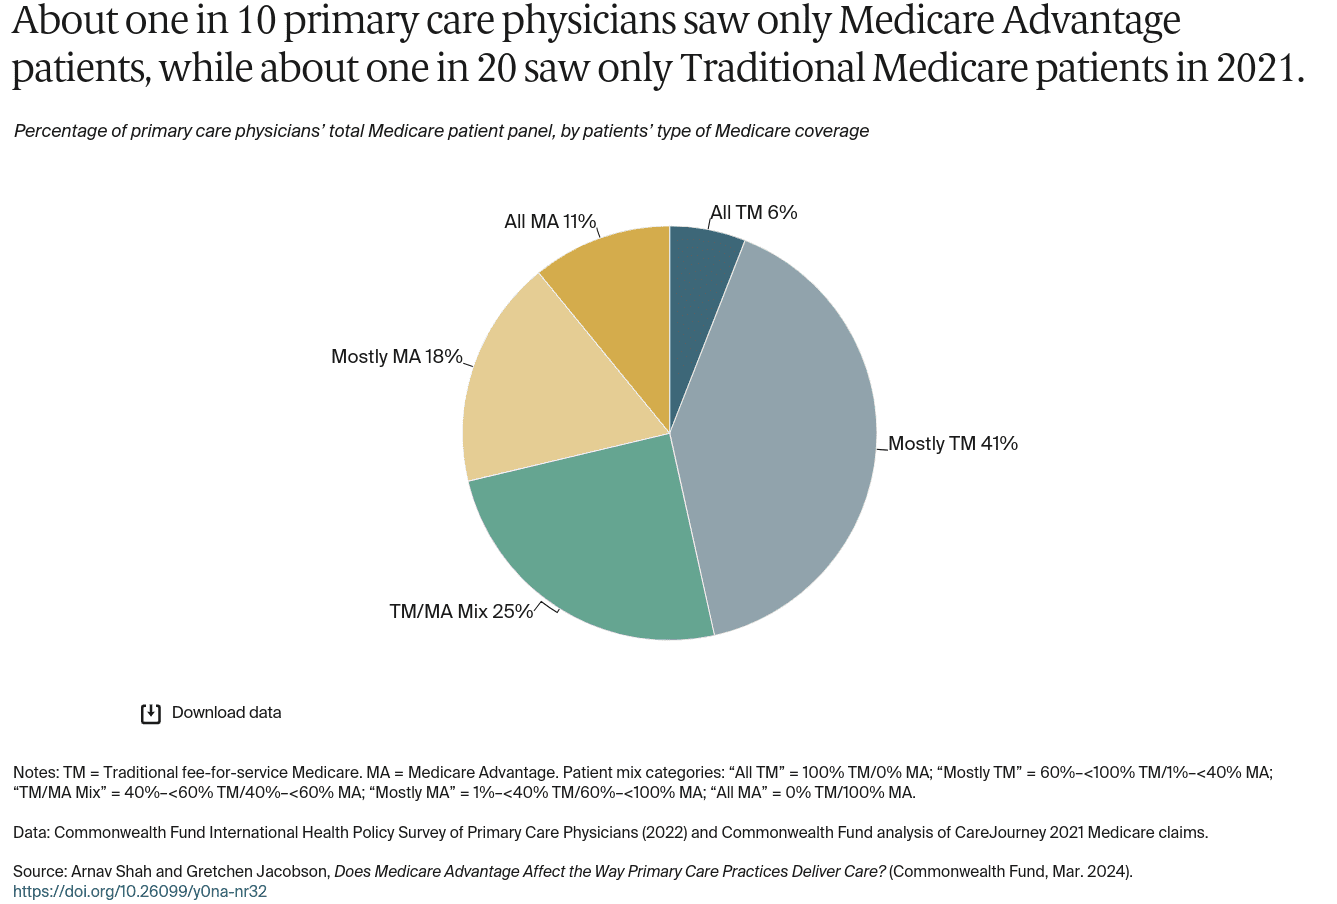
- In 2021, about one in 10 primary care physicians saw only patients enrolled in MA plans and about one in 20 saw only patients enrolled in traditional Medicare.
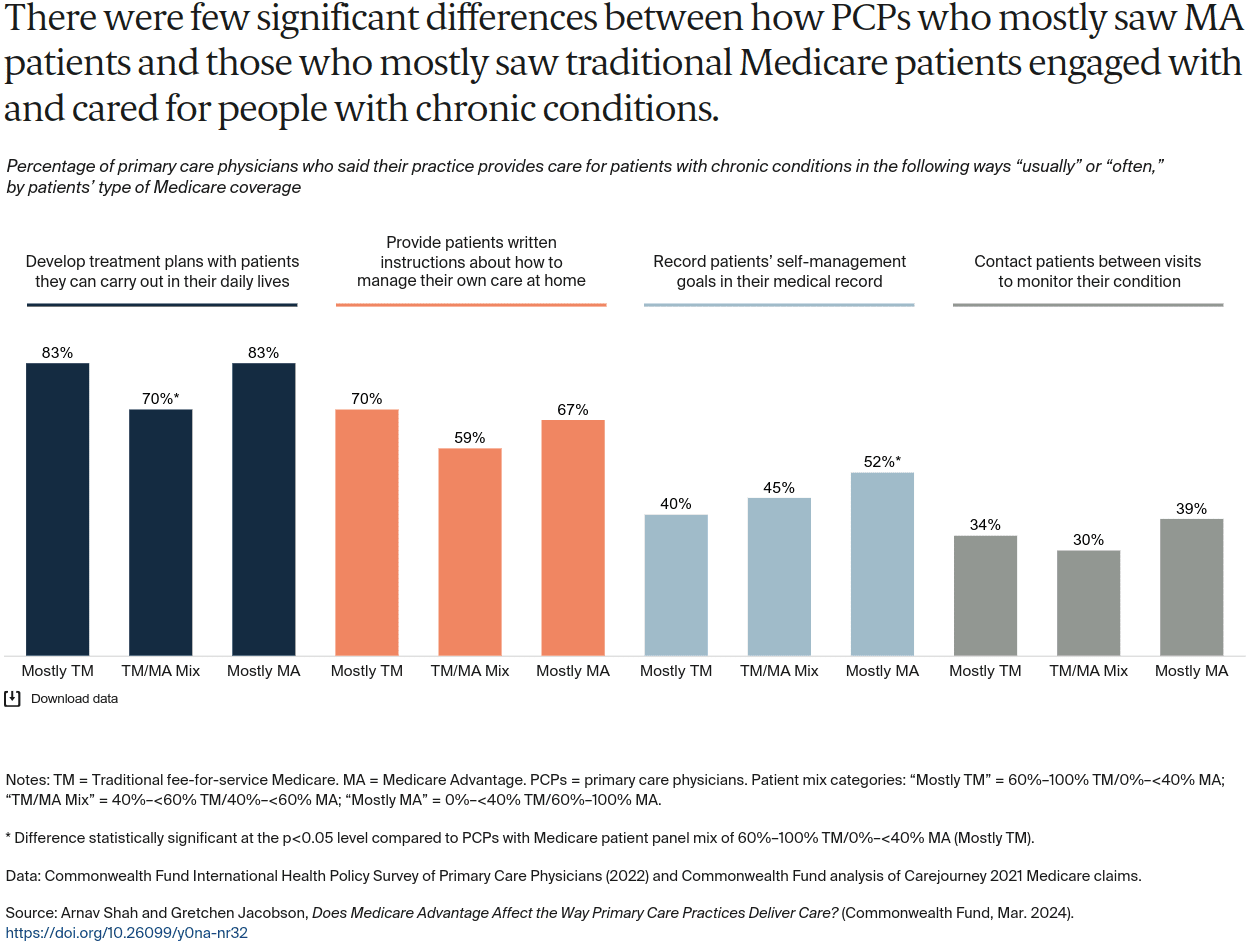
- When it came to caring for patients with chronic conditions, there were few significant differences between PCPs who mostly saw MA patients compared to those who mostly saw traditional Medicare patients.
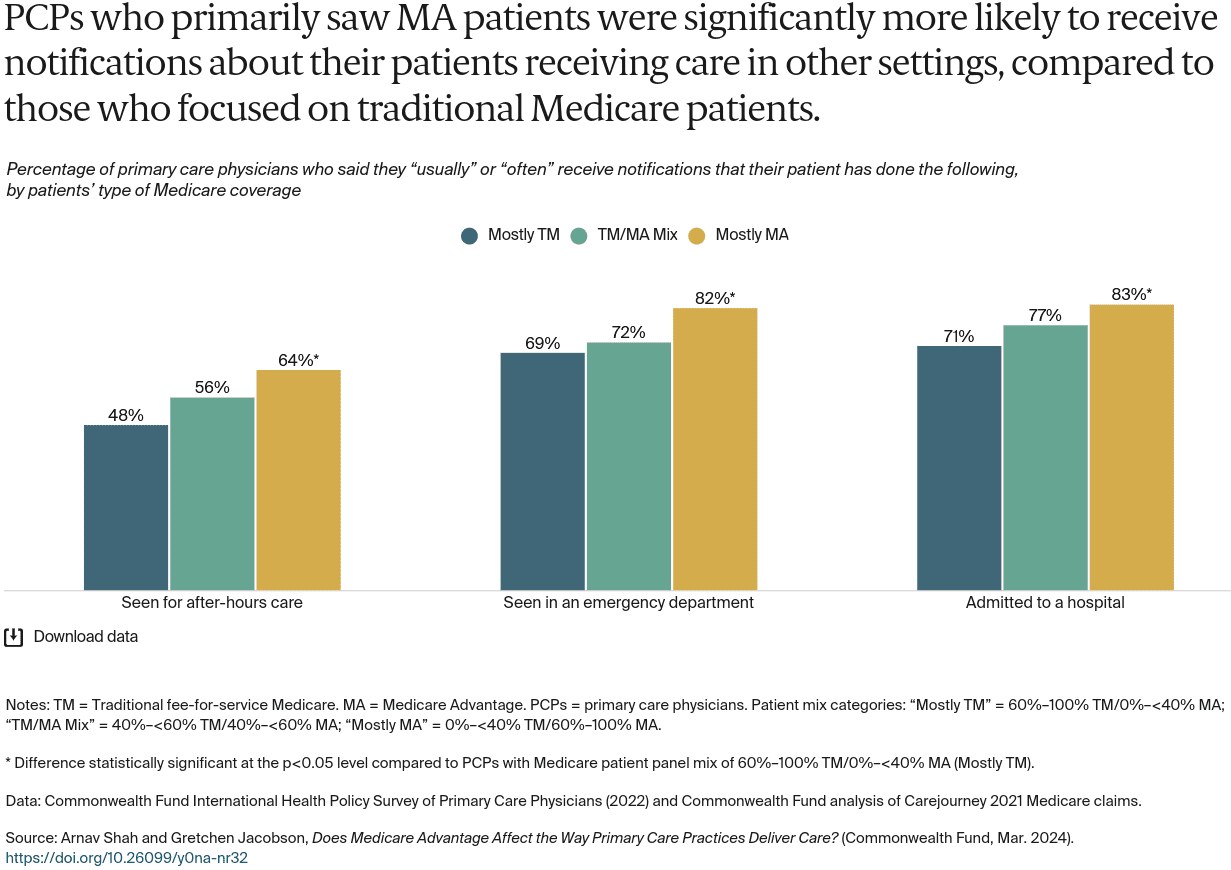
- Compared to those who mostly saw traditional Medicare patients, PCPs with predominantly MA patients reported higher rates of care coordination, but overall, there were not many statistically significant differences between the two groups.
Click Image For Full View
Click Image For Full View
Click Image For Full View
Click Image For Full View
Click Image For Full View
Click Image For Full View
Discussion
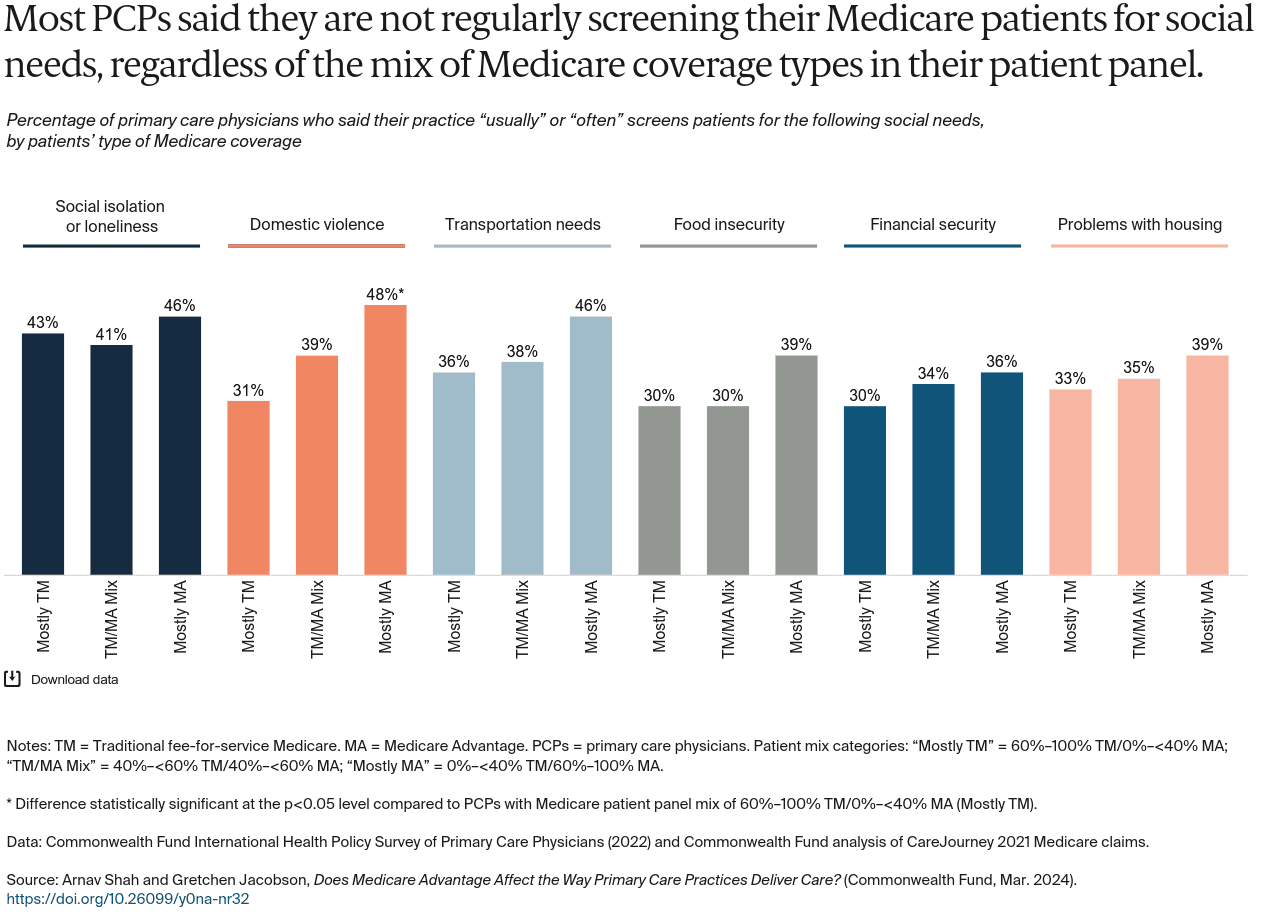
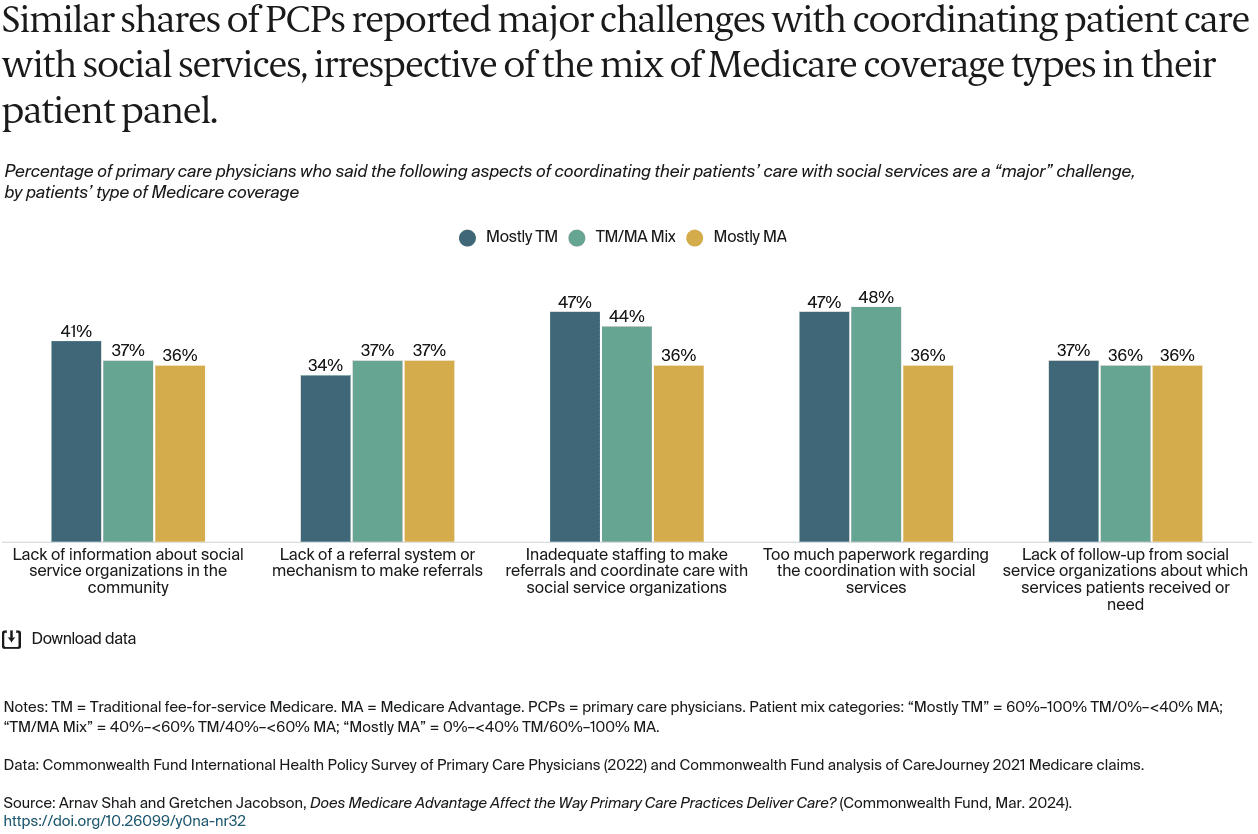
Medicare Advantage plans receive capitated payments to provide plans the flexibility to help manage patients’ care. This analysis shows that across many measures of care coordination, there were no significant differences in responses based on the mix of Medicare coverage among a primary care physician’s panel of patients. Physicians who predominantly saw MA patients reported being notified regularly about their patients receiving care in other settings. Primary care physicians who mostly saw MA patients also reported the highest rates of screening for domestic violence issues, but there weren’t significant differences by patient mix in reported screening for other social needs. Overall, the majority of PCPs did not report regularly screening for social needs such as housing or food insecurity.
The lack of significant differences between PCP groups on most of the study’s measures suggests either MA plans have limited influence on care delivery or there are sizeable spillover effects — meaning that even a comparatively low number of MA patients may be influencing how a PCP functions, impacting all their patients. The findings also show the limited influence of MA plans in addressing key challenges that providers face, as one insurer typically constitutes only a small slice of a physician’s insurance panel. It may be that only large insurers that dominate markets can influence primary care. PCP samples for each group in this study are also relatively small, which means only large differences between the groups were statistically significant.
As MA enrollment continues to grow, the effects on primary care practices will be important to monitor. If plans are providing resources to PCPs to manage their patients more efficiently, this could have positive effects for all patients in the practice. If plans are not enabling efficiencies, however, or plans are adding onerous requirements that make it more difficult to care for patients, then it could have a negative impact on physician care. A greater understanding of plans’ support, incentives, and requirements on physicians’ practices will shed light on their effects on patient care for all Medicare beneficiaries.
HOW WE CONDUCTED THIS STUDY
The 2022 Commonwealth Fund International Health Policy Survey of Primary Care Physicians was administered to nationally representative samples of practicing primary care doctors in Australia, Canada, France, Germany, the Netherlands, New Zealand, Sweden, Switzerland, the United Kingdom, and the United States. These samples were drawn at random from government or private lists of primary care doctors in each country except France, where they were selected from publicly available lists of primary care physicians. Within each country, experts defined the physician specialties responsible for primary care, recognizing that roles, training, and scopes of practice vary across countries. In all countries, general practitioners and family physicians were included, with internists and pediatricians also sampled in Switzerland and the United States. This brief utilized data from respondents in the United States. The questionnaire was designed with input from country experts and pretested in most countries. Pretest respondents provided feedback about question interpretation via semistructured cognitive interviews. The survey research firm SSRS was contracted to field the survey in the U.S. and Canada, as well as collaborate with fieldwork partners and oversee survey administration in the other countries. SSRS also provided methodological oversight for the study as a whole, including supporting questionnaire development, consultation and design of sampling protocols, and managing the statistical weighting across countries. The survey was fielded from February through September 2022; the field period ranged from eight to 31 weeks across all countries. In the United States, the survey was in the field from February 8 to August 24, 2022. Survey modes (mail, online, and telephone) were tailored based on each country’s best practices for reaching physicians and maximizing response rates. Sample sizes ranged from 321 to 2,092, and response rates ranged from 6 percent to 40 percent. In the United States the total sample was 1,059 and the response rate was 18.8 percent. Across all countries, response rates were lower than in 2019. Final data were weighted to align with country benchmarks along key geographic and demographic dimensions. In the United States, respondents were given the option of providing their National Provider Identifier (NPI), a unique identification number for all providers that can be used when analyzing claims data to identify the physician who has overall responsibility for a beneficiary’s care and treatment. 502 respondents in the United States provided their NPIs. The data of respondents who provided their NPIs were reweighted to align with geographic and demographic benchmarks. The respondents who did provide their NPIs were not demographically very different from the overall U.S. sample, but there may be unmeasured differences between those who did provide their NPI versus those that did not that could not be observed in the data. If they existed, such differences could make the analyzed sample not representative of primary care physicians in the U.S. CareJourney, a health care analytics company, then linked the NPIs provided by survey respondents to their 2021 Medicare claims data, including the number of unique patients each provider saw, split by Medicare coverage type (traditional fee-for-service Medicare, or TM; and Medicare Advantage, or MA). Due to lags in MA encounter data, CareJourney used Medicare Part D prescription records as a proxy to determine which physicians these MA patients are seeing, as it would be the same physicians that patients are seeing to get prescriptions. CareJourney then aggregated patient counts as the total MA patients that such NPIs have seen in the year. 453 survey respondents who provided their NPIs had 2021 claims data that included these unique patient panel counts — this was the final sample used for this analysis. We then calculated the Medicare coverage compositions of each physician’s patient panel by dividing each coverage type (TM and MA) by the total number of unique Medicare patients seen by each physician. We classified physicians into three categories of Medicare patient panels: 60%–100% TM/0%–<40% MA (212 respondents), 40%–<60% TM/40%–<60% MA (110 respondents), 0%–<40% TM/60%–100% MA (131 respondents), and analyzed survey responses by those classifications of patient panel mixes.[/et_pb_text][et_pb_text ul_item_indent="35px" _builder_version="4.24.3" _module_preset="default" locked="off" global_colors_info="{}"]ACKNOWLEDGMENTS
The authors thank Robyn Rapoport, Rob Manley, Christian Kline, and Molly Fisch-Friedman of SSRS; Chris Ji, Sarah Grace, and Katie Mulrean of CareJourney; and the Commonwealth Fund’s Celli Horstman, Corinne Lewis, Melinda Abrams, Sara Collins, Rachel Nuzum, Aishu Balaji, Chris Hollander, Paul Frame, Jen Wilson, Faith Leonard, and Evan Gumas.NOTES
- Medicare Payment Advisory Commission, “The Medicare Advantage Program: Status Report,” in Report to the Congress: Medicare Payment Policy (MedPAC, Mar. 2023); and Eva DuGoff et al., “Quality, Health, and Spending in Medicare Advantage and Traditional Medicare,” American Journal of Managed Care 27, no. 9 (Sept. 2021): 395–400. ↩
- Katherine Baicker, Michael E. Chernew, and Jacob A. Robbins, “The Spillover Effects of Medicare Managed Care: Medicare Advantage and Hospital Utilization,” Journal of Health Economics 32, no. 6 (Dec. 2013): 1289–300; Garret Johnson et al., “Recent Growth in Medicare Advantage Enrollment Associated with Decreased Fee-for-Service Spending in Certain U.S. Counties,” Health Affairs 35, no. 9 (Sept. 2016): 1707–15; Laura S. Kaiser and Thomas H. Lee, “Turning Value-Based Health Care into a Real Business Model,” Harvard Business Review, Oct. 8, 2015; Fangli Geng et al., “Increased Medicare Advantage Penetration Is Associated with Lower Postacute Care Use for Traditional Medicare Patients,” Health Affairs 42, no. 4 (Apr. 2023): 488–97; and Yevgeniy Feyman, Steven D. Pizer, and Austin B. Frakt, “The Persistence of Medicare Advantage Spillovers in the Post‐Affordable Care Act Era,” Health Economics 30, no 2 (Feb. 2021): 311–27. ↩
Recent Comments